Lighthouse Extension Beta Release

:loudspeaker: We are thrilled to announce that the “Lighthouse” extension is out. (Psst. Beta for NOW)

Our test results showed that you could save 11 mins / 30 sites. Do the Math for hundreds!!!

Moreover, you don’t need to open 30 tabs to test and then look for what stats are on which website. Such a hassle & time-consuming we would say, to be honest!

A glimpse of what you could expect from the Lighthouse extension:

  • Check hundreds of websites’ Lighthouse stats at once on one screen.

  • Add metrics to reports and send them to clients.

  • Set daily to monthly frequency to run test(s).

The Extension is already available in all our Pro user accounts and we would appreciate members, that have time, to test and give their honest feedback.

You will need to be on MainWP Dashboard version 4.1.10.3 or better for this Extension

:hugs: from the team MainWP.

6 Likes

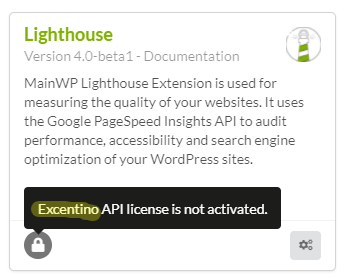
Just installed it to test it. I’m not sure if this textual bug is specific for this extension, but it says “Excentino API license”:
image
There was no issue activating the license, so it’s just a text bug.

Another text adjustment on the Lightspeed settings page:
image

Links to the documentation lead to kb.mainwp.com and not to specific pages, so users need to search the KB. Please create direct links.

Now it’s time for running some audits, but I’ll start with a few and not directly all (235) sites. I’ll come back if I have more info about that.

2 Likes

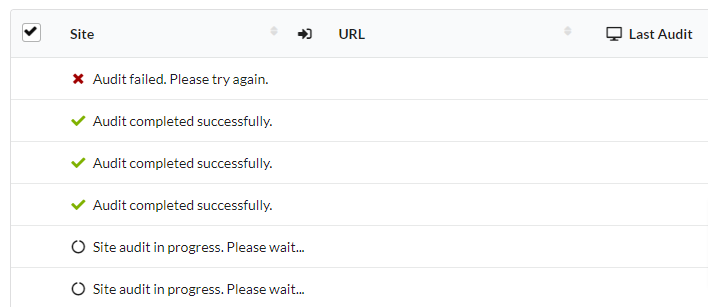
I don’t really see a load issue when doing an audit fo 10 or 25 sites at bulk. Only 4 sites are really processed at the same time.

As the status is showing inline I see a UX issue, because I can’t see which site is processed as the site info becomes invisible during the audit:


It would be better if the site is still visible.

2 Likes

How do I remove the Lighthouse widget from my MainWP Overview page?

Today I noticed that the Lighthouse widget on the MainWP Overview page gave a critical error (nothing in my logs though, but that might be an issue on my new server) and also the Lighthouse page gave a critical error.

When enabling WP_DEBUG, nothing changed at first, but after a few more refreshes (local cache was already disabled) the widgets showed up again but only in 2 columns instead of 3 (right column was empty). Dragging widgets to the right didn’t work. They can be dragged but stick to other widgets (seems like a conflicting structure) and not to the 3rd column. I noticed some errors in the browser console about not fitting content, but I don’t have the exact message.

I’ve disabled the Lighthouse extension and the widgets are back how they were. Hopefully the devs can already replicate some of these issues. I’ll do some more research as well.

Hi @josklever, thanks for pointing out typos and the UX issues.

I just cleaned up these small errors.

  • Extension activation notice (tooltip), this is fixed in the Dashboard plugin and it will be included in the next release.
  • Documentation URLs are updated
  • The typo in the info message is fixed
  • I couldn’t duplicate the problem with the widget, but I cleaned it up a bit so maybe that helps on your side
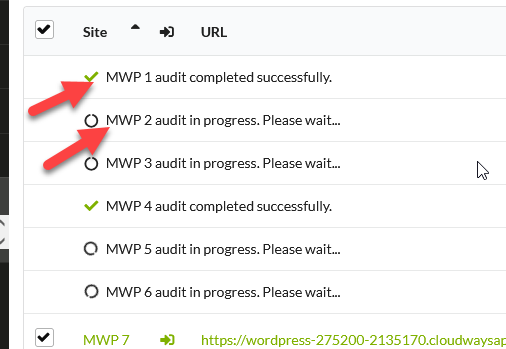
  • Bulk audit process indicators are updated and show the child site name:

image

The new version of the extension is uploaded to our repo, so if you reinstall it, you will get the updates.

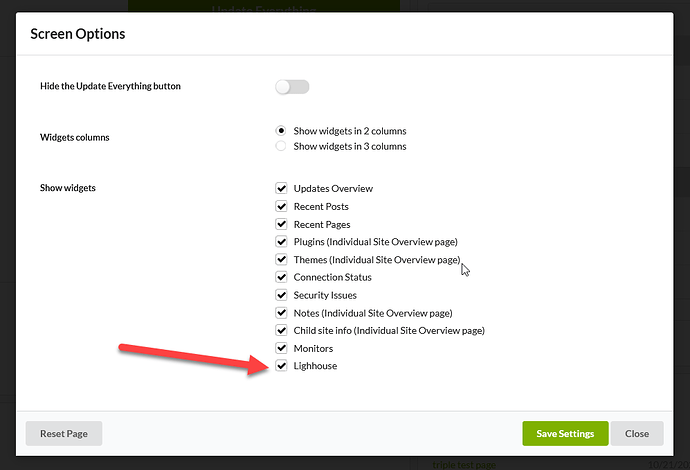
Hi @peacekeeper, In this update, I added the option to hide/unhide the widget. The option is now available in the Overview page Screen Options modal like all other widgets

2 Likes

I’ve done a reinstall of the extension.
There’s a new typo in your the dashboard settings (last screenshot):
image

The dashboard widgets are shown in 3 columns now (I’ll keep an eye on it). The Lighthouse Widget does show a critical error has occurred, but again nothing in the PHP error log. Same for the Lighthouse extension page.

The errors in the browser console if Lighthouse extension widget is enabled on overview:
File: semantic.min.js:11
Error:
Sticky: Sticky element is larger than its container, cannot create sticky. s.fn.init [div#mainwp-top-header.ui.sticky]
Details:

error @ semantic.min.js:11
checkErrors @ semantic.min.js:11
initialize @ semantic.min.js:11
(anonymous) @ semantic.min.js:11
each @ load-scripts.php?c=1&load[chunk_0]=jquery-core,jquery-migrate,utils,zxcvbn-async&ver=96d4dbe541c011e7c2935789fd6b6369:2
T.fn.sticky @ semantic.min.js:11
(anonymous) @ admin.php?page=mainwp_tab:7453
e @ load-scripts.php?c=1&load[chunk_0]=jquery-core,jquery-migrate,utils,zxcvbn-async&ver=96d4dbe541c011e7c2935789fd6b6369:2
t @ load-scripts.php?c=1&load[chunk_0]=jquery-core,jquery-migrate,utils,zxcvbn-async&ver=96d4dbe541c011e7c2935789fd6b6369:2
setTimeout (async)
(anonymous) @ load-scripts.php?c=1&load[chunk_0]=jquery-core,jquery-migrate,utils,zxcvbn-async&ver=96d4dbe541c011e7c2935789fd6b6369:2
c @ load-scripts.php?c=1&load[chunk_0]=jquery-core,jquery-migrate,utils,zxcvbn-async&ver=96d4dbe541c011e7c2935789fd6b6369:2
fireWith @ load-scripts.php?c=1&load[chunk_0]=jquery-core,jquery-migrate,utils,zxcvbn-async&ver=96d4dbe541c011e7c2935789fd6b6369:2
fire @ load-scripts.php?c=1&load[chunk_0]=jquery-core,jquery-migrate,utils,zxcvbn-async&ver=96d4dbe541c011e7c2935789fd6b6369:2
c @ load-scripts.php?c=1&load[chunk_0]=jquery-core,jquery-migrate,utils,zxcvbn-async&ver=96d4dbe541c011e7c2935789fd6b6369:2
fireWith @ load-scripts.php?c=1&load[chunk_0]=jquery-core,jquery-migrate,utils,zxcvbn-async&ver=96d4dbe541c011e7c2935789fd6b6369:2
ready @ load-scripts.php?c=1&load[chunk_0]=jquery-core,jquery-migrate,utils,zxcvbn-async&ver=96d4dbe541c011e7c2935789fd6b6369:2
B @ load-scripts.php?c=1&load[chunk_0]=jquery-core,jquery-migrate,utils,zxcvbn-async&ver=96d4dbe541c011e7c2935789fd6b6369:2

At this moment widgets can’t be moved. If I disable the widget that’s working again and removing the errors.

Hi Jos,

Thanks for the update.

The new typo is fixed too.

I will look into the console error and try to duplicate it.

1 Like

Hi @josklever,

do you get the same console errors if you deactivate all other extensions temporarily?

I tried to duplicate the problem, but I couldn’t. Everything works normally in my test setup.

Yes, with only these plugins active:
MainWP Child 4.1.8
MainWP Dashboard 4.1.10.3
MainWP Lighthouse Extension 4.0-beta1

However, after moving between Plugins page and MainWP Dashboard a few times, the widget is showing again and the errors in the browser console are gone. The Lighthouse Extension page is also showing the same behavior. Maybe it’s related to the number of clients (235 (+1 disconnected)) that it’s sometimes working and sometimes not. It doesn’t look like a server load issue, because that’s <10%.

If I do a Ctrl + F5 (hard refresh) twice (maybe sometimes more), it’s working again, until it isn’t later again.

Hi Jos,

If possible, can you open a helpdesk ticket so I can have our dev team check this?

1 Like

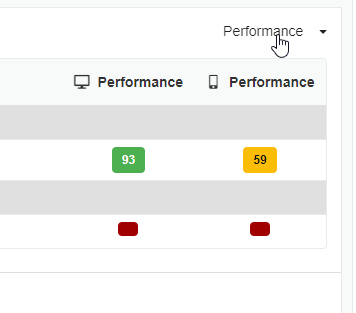
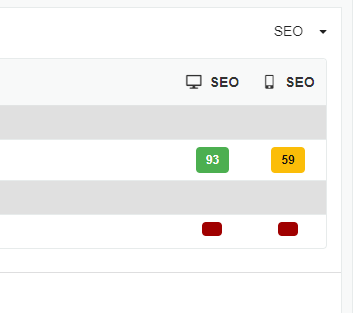
With the first version I had the following widget problem. When we try to select in dropdown for example the SEO score, absolutely nothing changes in the table, the same data remained and in the head of the table it was still written Performance.

I recently updated to the new version. The category is already changing at the top of the table, but the scores remain the same from performance.

2021-11-11_195551
2021-11-11_195621

Also, the same behavior of the widget, which Jos Klever described, was with me. I tried and deactivated and reactivated the extension. After this procedure, the widgets have returned to normal, in 3 columns, and I can rearrange them as desired.

1 Like

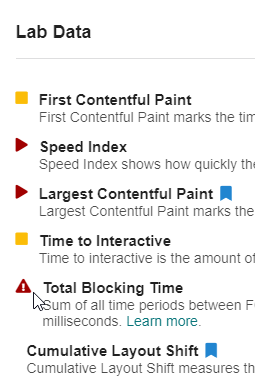
I found that for the warning icon instead of “play icon” you can use “exclamation triangle”.

And I noticed that the “Cumulative Layout Shift” chapter for Mobile is missing the icon.

Here is the explanatory image for the points above:
2021-11-11_203605

In the report, in the table with the audit results, some data from some tables are missing. For example at “JavaScript execution time”, in the data table, the execution times are missing. And so on to several tables inside the audit results.

Suggestions:
Both suggestions below are not critical, in my opinion subjective would make browsing the report more convenient.

If it is possible to make the navigation through the tabs with the results of the report to be above the audit table itself. Because now you have to click on the score circle, then scroll to the audit result, and so on several times.

If possible add another button to display all audit points. Because from the beginning all the audit points are presented, and once a filter button is pressed, for example “Failed audit”, it is not possible to return to displaying all without refreshing the page.
And to highlight which filter is activated now.
I mean this section of buttons:

As a suggestion for the future:
It would be useful in the future to develop the functionality of displaying the evolution of a site’s scores, as well as displaying this data in customer reports. This is to understand what is really happening with performance, in our case with the first page.

And it would be useful to add for reporting several pages on a site, maybe not so detailed with audit tips, but at least with the scores would be very useful.

Maybe I should write these development suggestions in Trello.

I’m getting an error “Your membership has been canceled. Reactivate your membership to install MainWP extensions.” I hit the Verify My Login button and it verifies, but the error doesn’t go away. Is it something I’m doing?

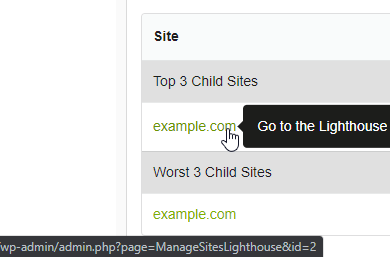
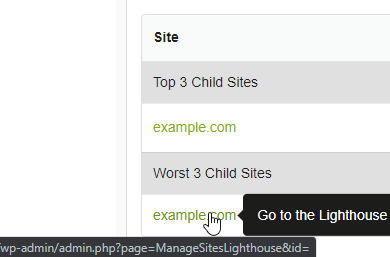
In the widget, the link to the site with the worst score has no id. Maybe only in my case, because for the test environment I use only one site added in this dashboard.

2021-11-12_141107
2021-11-12_141220

@fotan, the problem should be fixed for you now.

Hi @danzubco,

thanks for your suggestions and report.
Some of the suggestions are already implemented in our working version, and some are still being worked on. We will probably implement all in the next beta release.

Regarding the bugs you reported, I couldn’t duplicate these on my test setup, would you be able to open a helpdesk ticket so we can collect some additional info and look into this?

It is. Thanks. You guys rock.

1 Like

Lighthouse Settings Page. Link to Help Documentation opens the Lighthouse Settings page in a new tab rather than going to a documentation page.

Screen Shot 2021-11-12 at 10.38.00 AM

1 Like

Hi, I am testing out this extension and so far works well and did the audit on +160 without any issues…
I noticed to UX issues:

  • you can’t show or hide columns which is related to the second point
  • if you want to see the mobile result, you have to scroll down of the page to see the horizontal scrolling bar…
    I can reduce the view to 10 per page but I like to see all the sites in one shot.
    But, overall, looks great! No error in the console.
    Fred